Introduction to Quarto

November 5, 2024
Sometimes we get confused into the terminology…
“[…] when the same analysis steps performed on the same dataset […] produce the same answer.” (Turing Way)

Why we need Reproducibility?
We need to have confidence that our research is good quality and we are doing good science
Peter Fisher (1993) compared seven different pieces of GIS software doing a viewshed analysis
and got seven (slightly) different results!

Let’s dive into Quarto
- Quarto is a new, open-source, scientific and technical publishing system
- Combine text and code to produce formatted documents
- Publish reproducible and dynamic presentations, dashboards, websites, blogs, and books in HTML, PDF, MS Word, etc.
- Multi-language support for R, Python, Julia, and more
- Quarto extends RMarkdown and shares similarities with Juypter Notebooks.
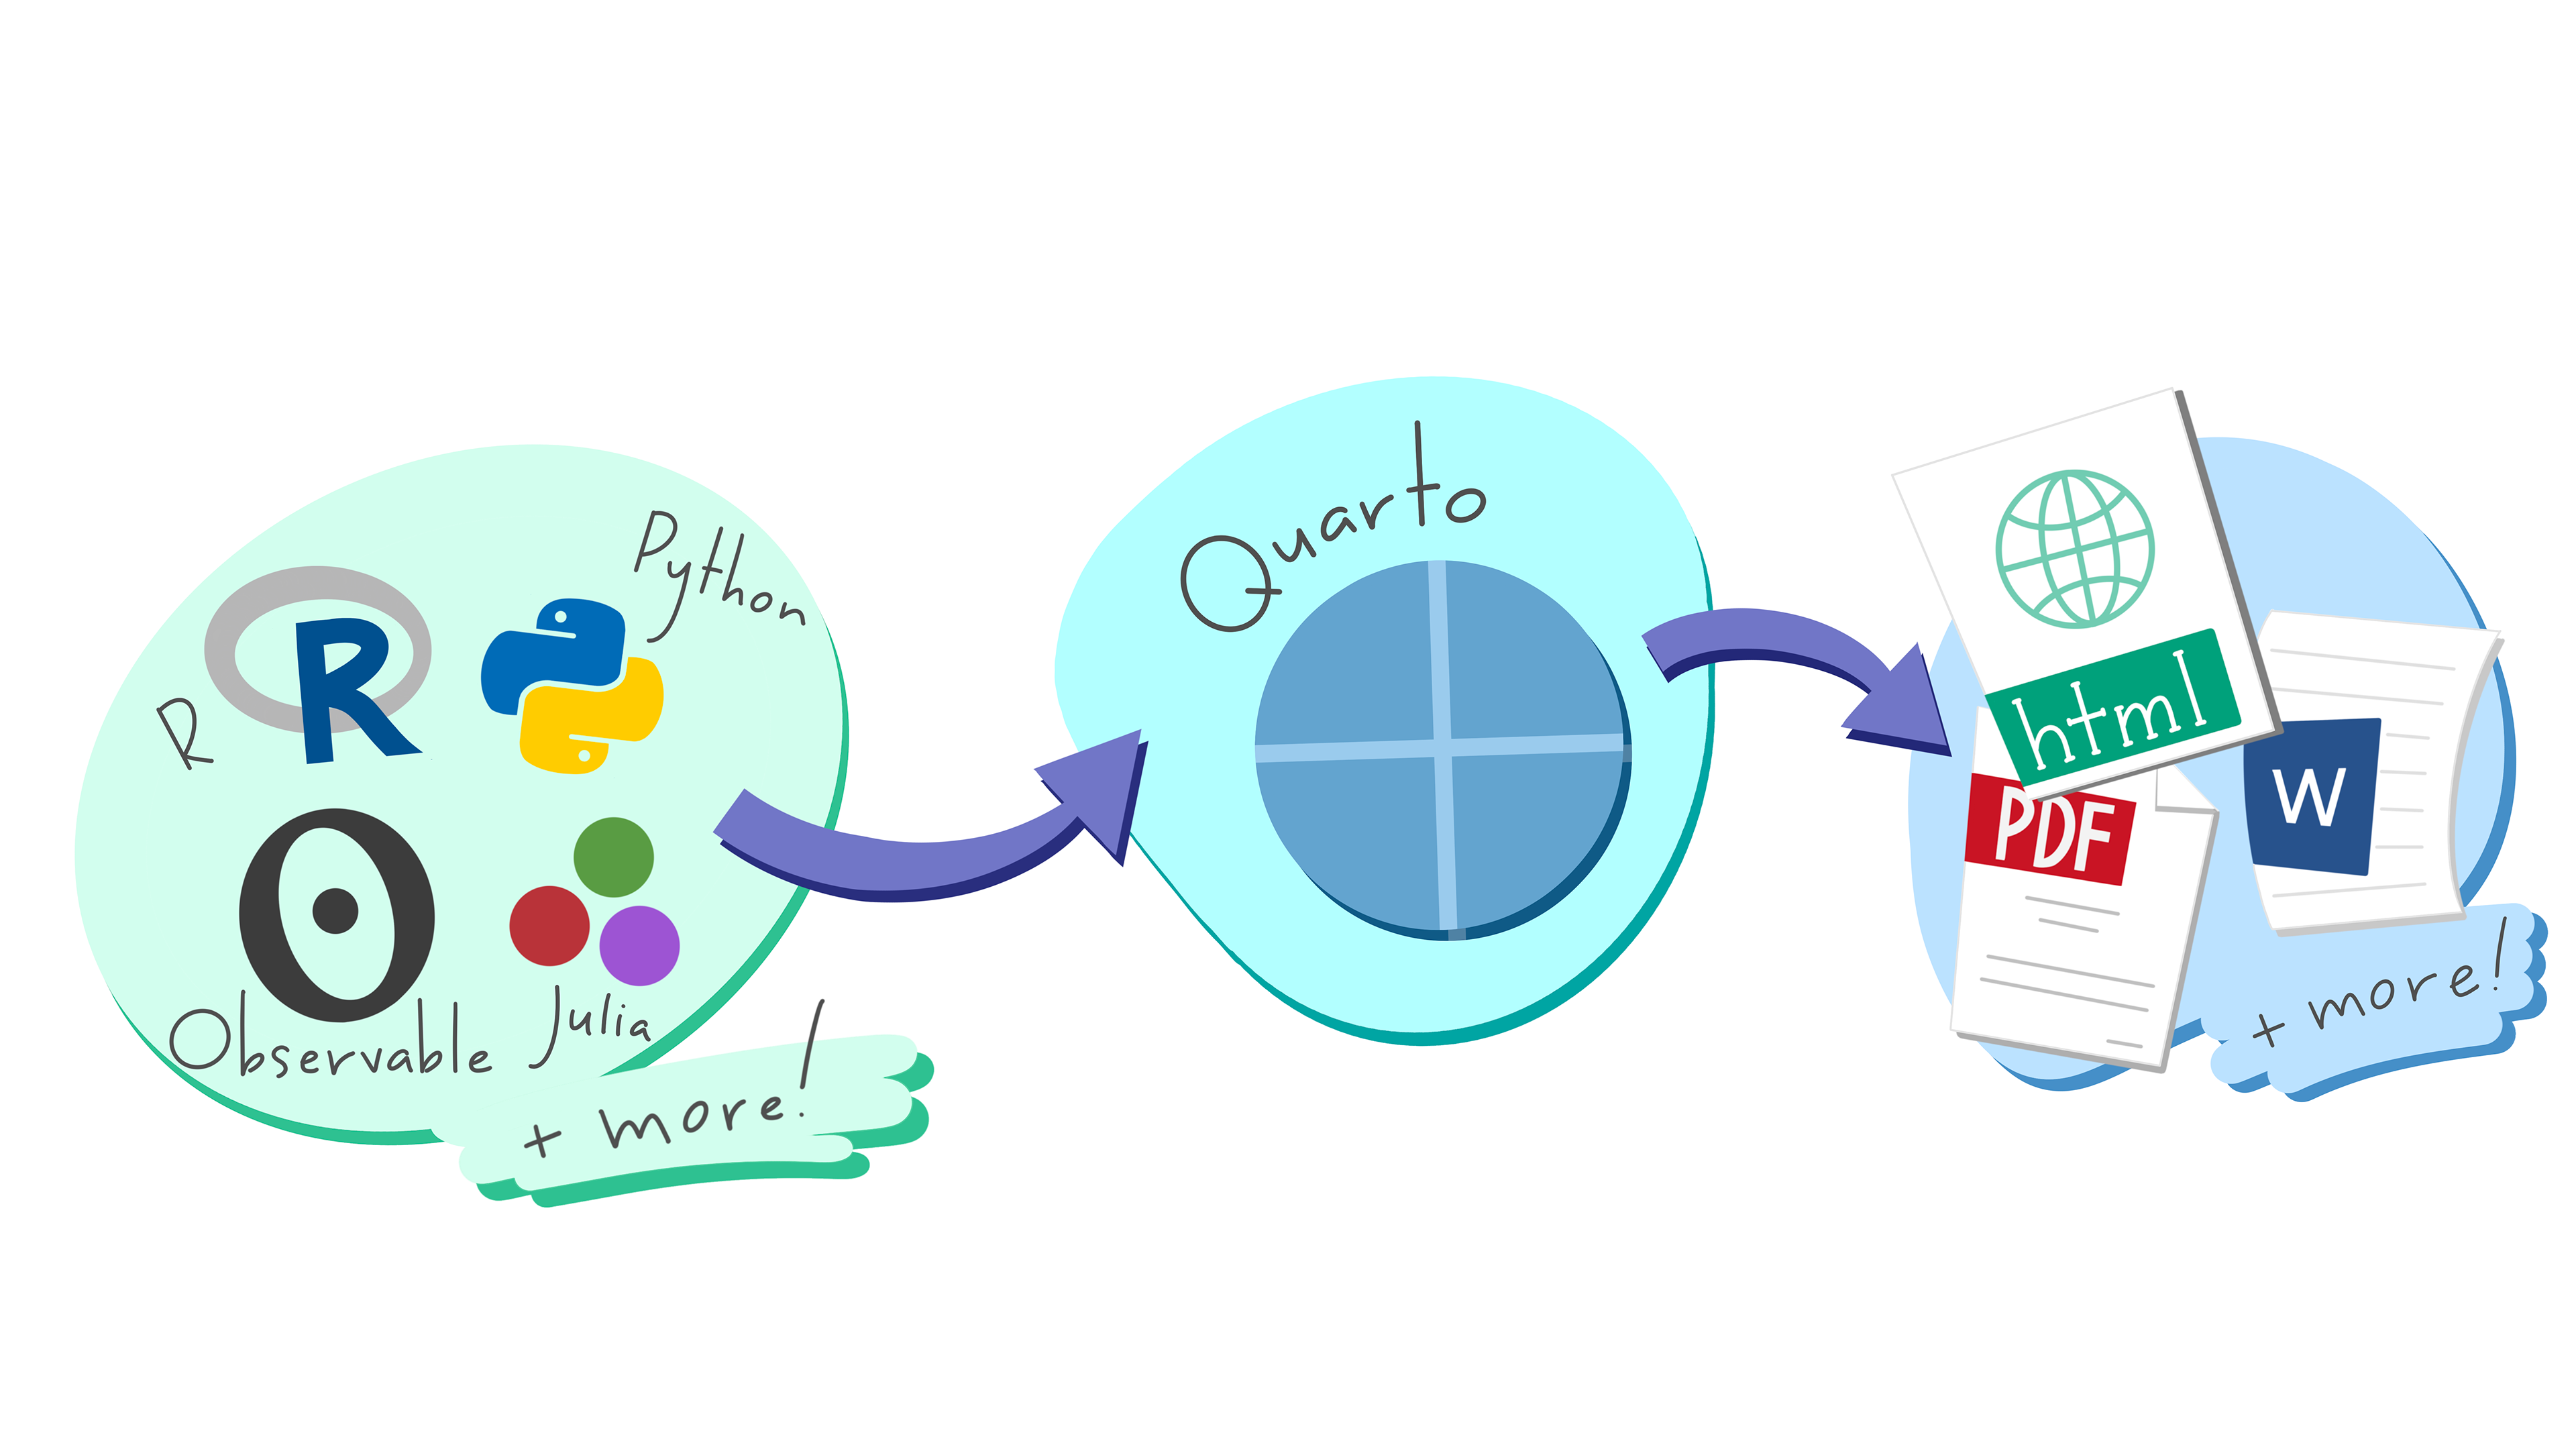
How does Quarto work?

taken from What is Quarto - A Quick Intro FAQ
.qmd

.ipynb

How does Quarto handle code chunks?
- example with the iris dataset (flowers)

Air Quality
Figure 1 further explores the impact of temperature on ozone level.

Figure 1: Temperature and ozone level.
Population density map in PA, 2010
- code was run in a markdown, and image saved

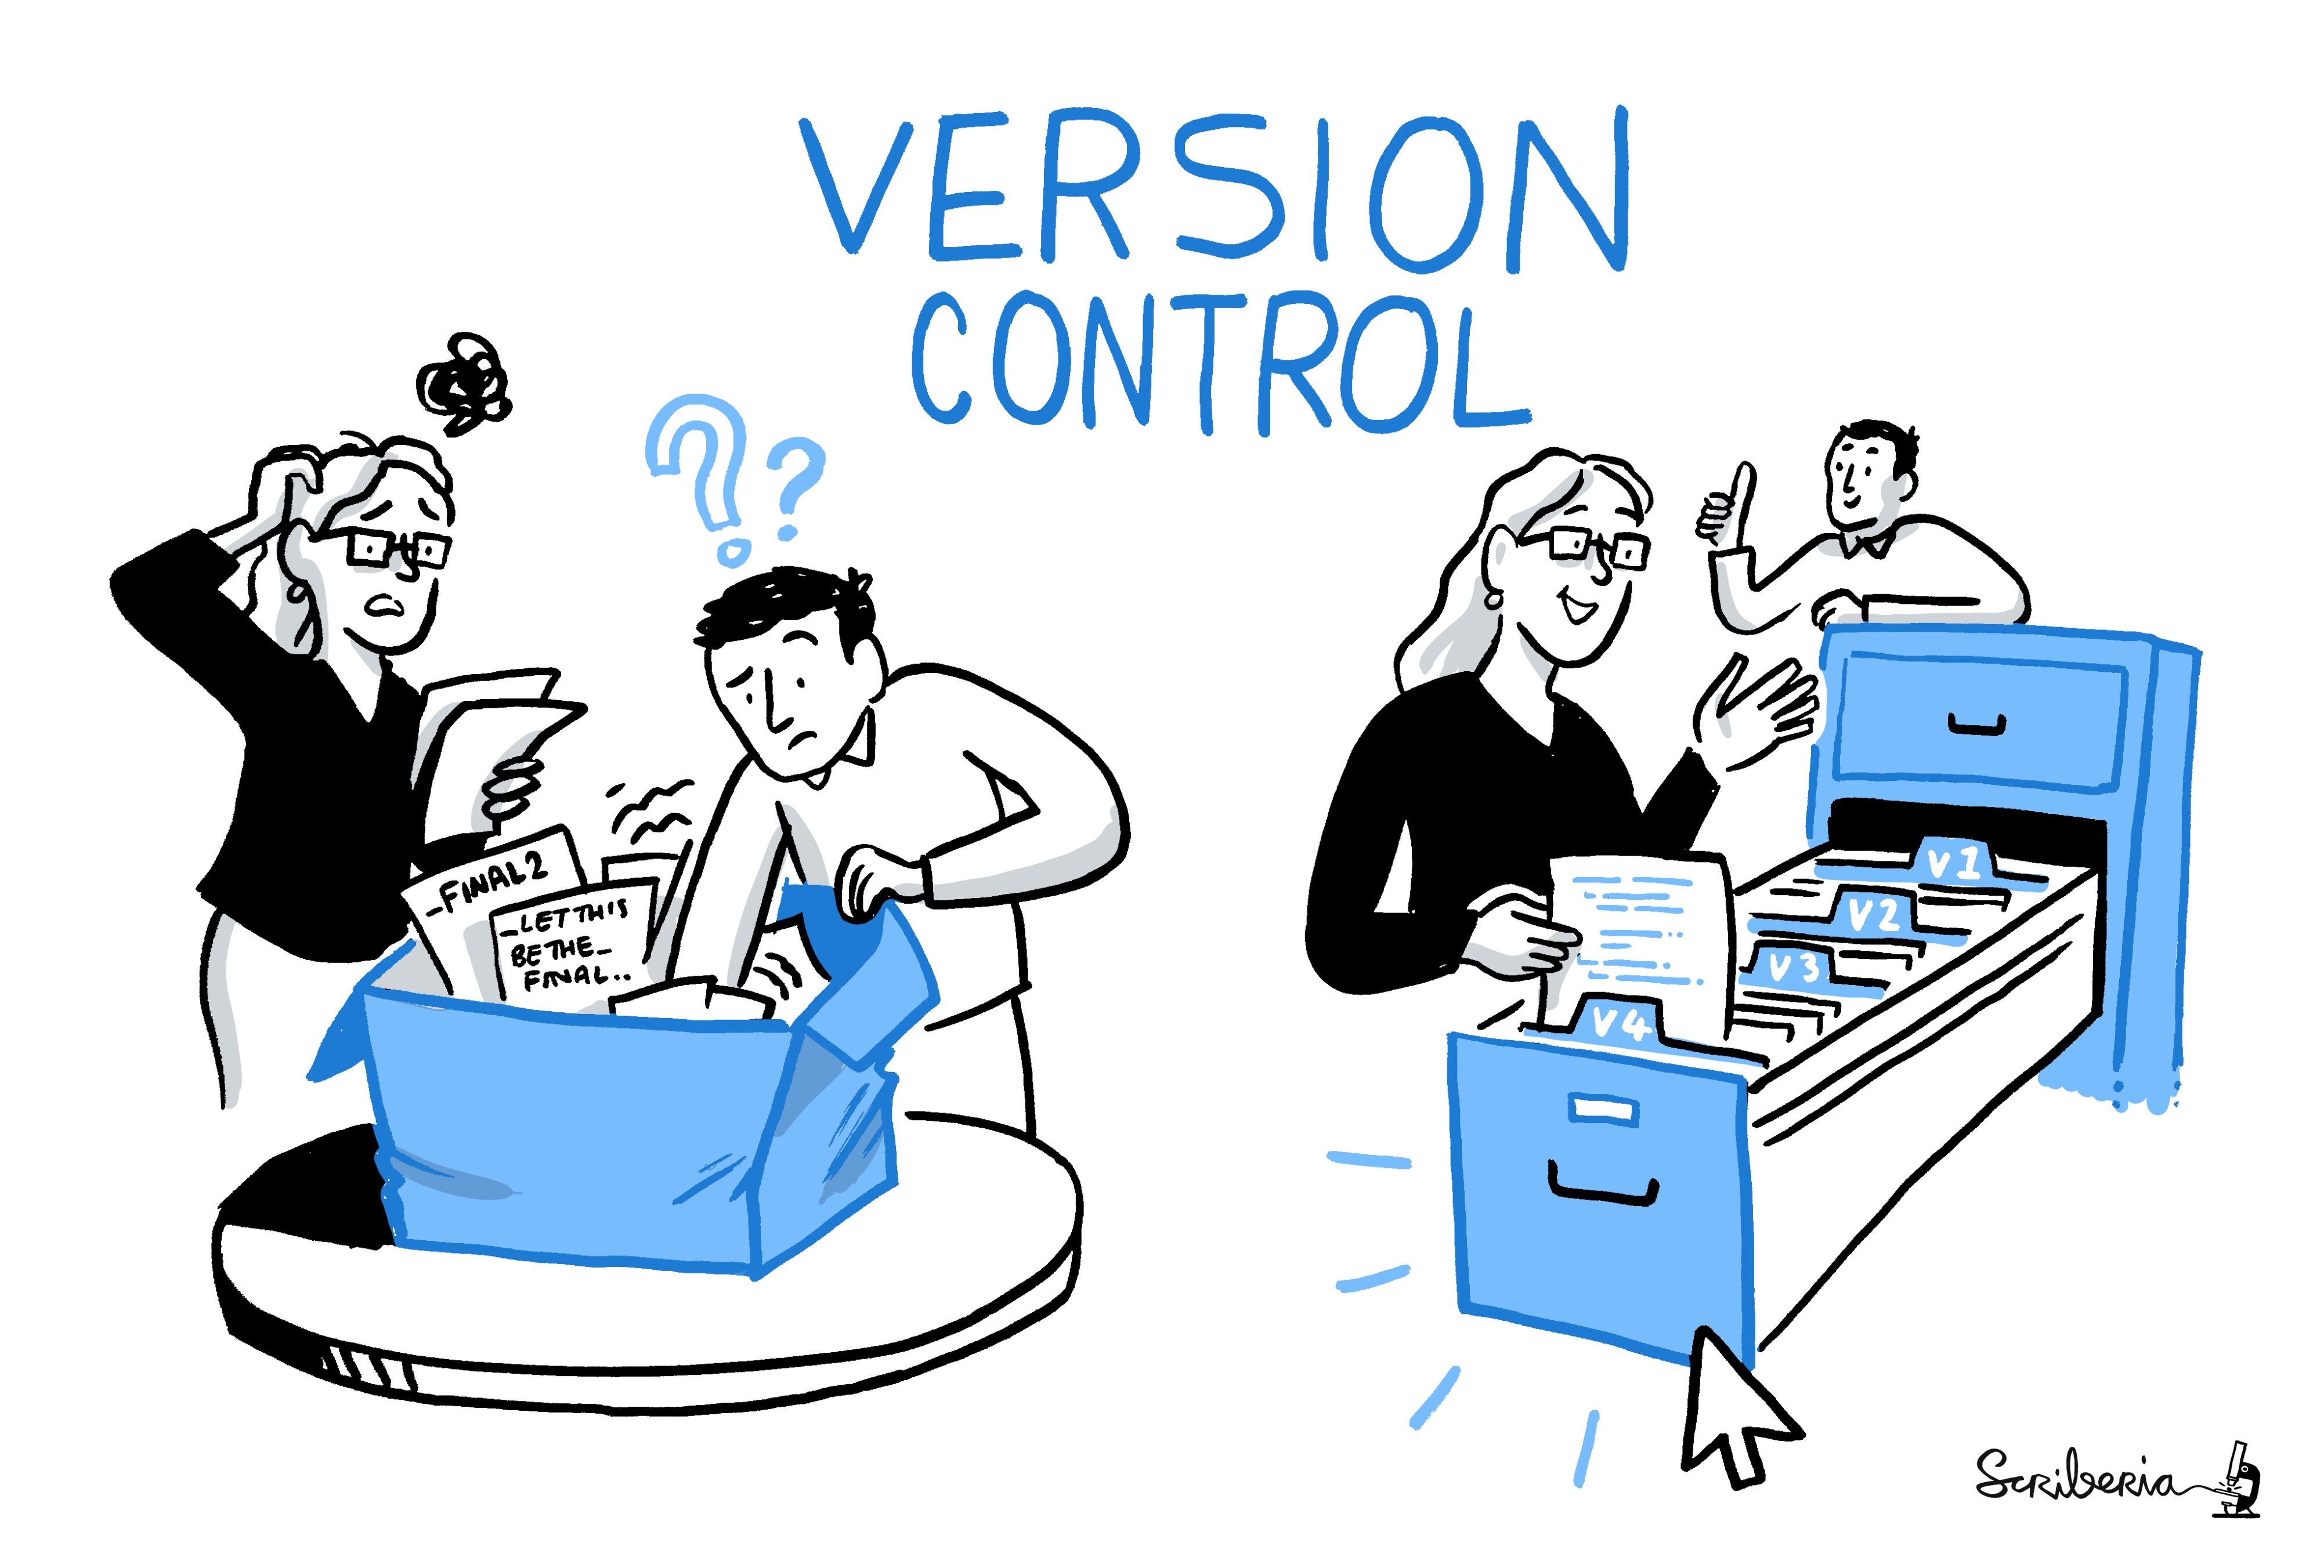
Key Benefit: (Explicit) Version Control

- Going back through time
- Great for collaboration
- Allow sharing and adaptation
- Just like this presentation
- Allows automation
Practice what you preach!
By setting up your teaching materials in a reproducible manner, you demonstrate the value of reproducibility directly
- Useful for others
- Useful for future you when you teach this course again